

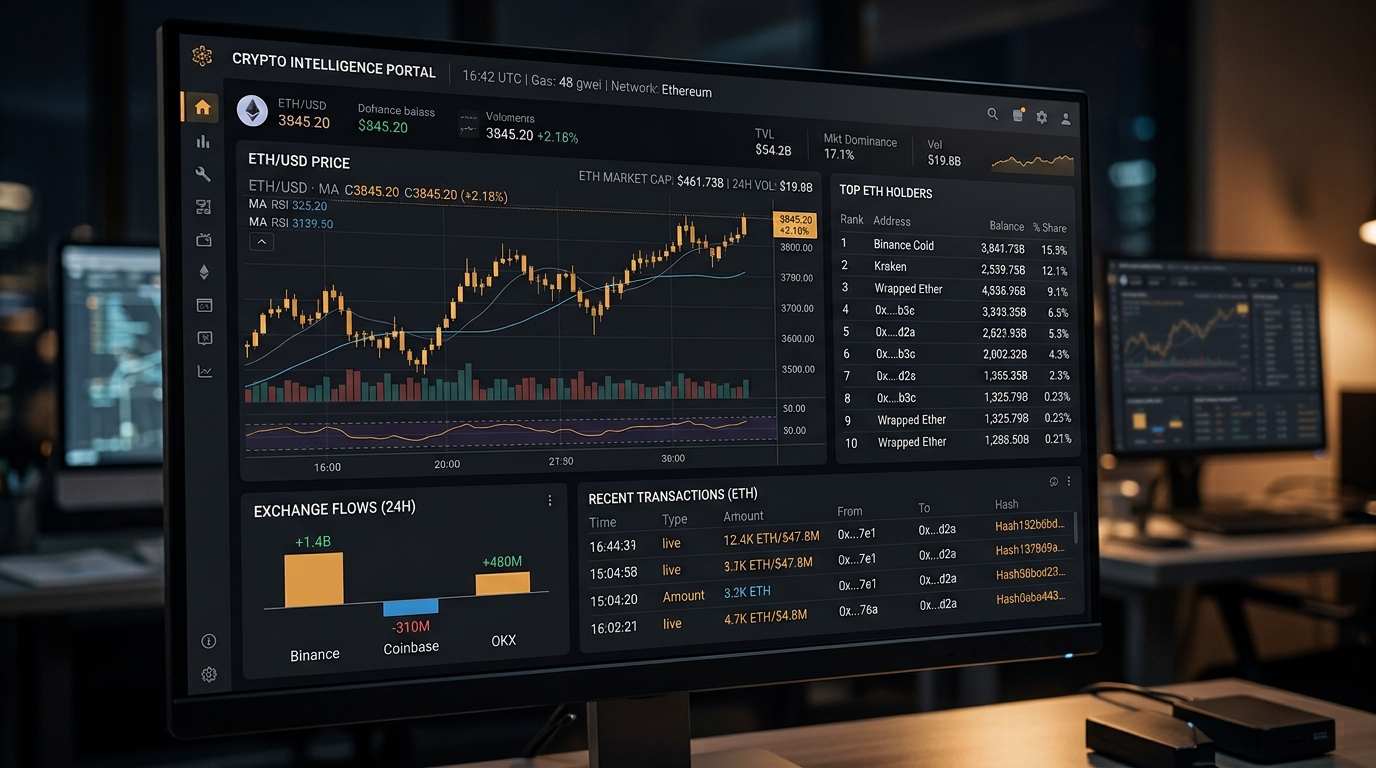
Arkham data brings several types of cryptocurrency information into one blockchain intelligence platform, including wallet activity, entity holdings, token prices, transaction flows, market metrics, charts, and real-time alerts. Instead of looking only at individual blockchain addresses, Arkham adds labels and entity relationships that can make on-chain activity easier to interpret.
For example, a traditional block explorer can show that a wallet sent 500 ETH to another address. Arkham can add additional context by showing whether an address is associated with a known exchange, fund, organization, trader, or other identified entity.
That distinction matters when researching whale activity, token holders, exchange flows, institutional wallets, trading behavior, or large transfers.
Arkham also provides token pages and dashboards where users can examine metrics such as price, market capitalization, volume, supply, holders and flows. Its market-data tools extend into spot, futures and options information, while custom alerts can notify users when selected wallets, entities, tokens or transaction conditions meet specified criteria.
This guide explains what the major categories of Arkham data mean, how to read its charts and metrics, and how to build a practical workflow around alerts without treating on-chain signals as automatic trading instructions.
Read more: What Is Arkham? Crypto Data, Features, and Best Uses
Table of Contents
What Is Arkham Data?
Arkham data is blockchain and market intelligence presented through wallets, entities, tokens, transactions, charts, dashboards and alerts. Its key distinction is the ability to organize raw blockchain addresses around identified entities and labels, making it easier to investigate who may be behind on-chain activity.
Arkham describes its data model as entity-first, rather than focusing exclusively on isolated addresses. Its API documentation also emphasizes that attribution is confidence-scored and probabilistic rather than an absolute identity claim.
This means users can move from a question such as:
“What did this wallet do?”
to a broader question:
“What is this entity doing across its associated wallets?”
That can be particularly useful for crypto research.
What Types of Data Does Arkham Provide?
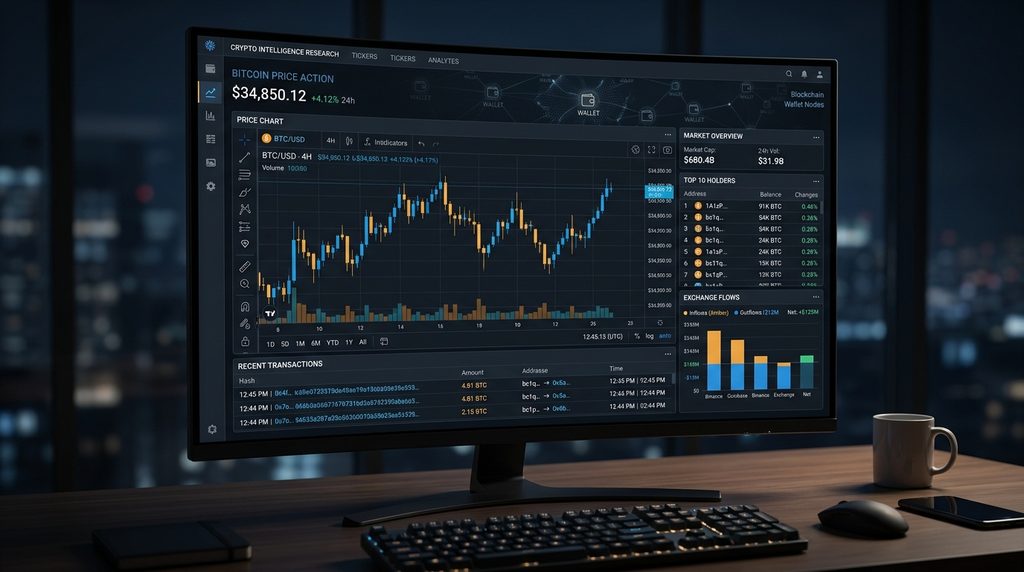
Arkham combines several categories of information.
| Data type | What you can examine |
|---|---|
| Wallet data | Balances, transactions, holdings and activity |
| Entity data | Identified organizations, traders, funds and other entities |
| Token data | Price, market cap, volume, holders and flows |
| Transaction data | Transfers, counterparties and transaction details |
| Market data | Spot, futures and options information |
| Chart data | Historical and real-time visualizations |
| Dashboard data | Customized combinations of metrics |
| Alert data | Notifications based on selected blockchain activity |
| Network data | Supported-chain activity and cross-chain research |
| Intelligence data | Labels, tags and attribution information |
Arkham’s current platform includes blockchain exploration, entity intelligence, analytics, dashboards, alerts, Visualizer, Tracer, market data and API access.
Arkham Prices: What Do the Numbers Mean?
One of the simplest ways to use Arkham is to research a token’s market information.
Arkham token pages can display metrics including price, supply, market capitalization, trading volume and historical high/low information, together with holder and transaction data.
Price
The price represents the current market value of the asset as presented by Arkham’s market-data infrastructure.
Price alone, however, tells you very little about ownership or on-chain behavior.
For research, it becomes more useful when combined with:
- Trading volume
- Market capitalization
- Top holders
- Exchange flows
- Large transfers
- Historical price movement
- Wallet activity
Market Capitalization
Market capitalization provides an indication of the token’s total market value based on the relevant supply and price data.
It is useful for comparing the relative size of assets, but it should not be interpreted as the amount of money invested in a token.
Trading Volume
Volume indicates the amount of trading activity over a specified period.
A sudden increase in volume alongside a major price movement can be worth investigating, but volume by itself does not establish whether a move is bullish or bearish.
Supply
Supply information helps put holder balances into context.
For example, knowing that a wallet holds a large number of tokens is more meaningful when you also understand what percentage of the relevant supply that represents.
Arkham Charts Explained
Charts turn raw blockchain and market data into patterns that are easier to inspect.
Arkham’s dashboard system supports different data units, including Address and Entity Intel, Token Intel, General charts, Spot and Exchange Futures, and Options.
Price Charts
Price charts help you examine how an asset has moved over time.
For useful research, compare price changes with other information rather than viewing the chart in isolation.
For example:
Price rises + increasing volume + significant wallet accumulation
can justify further investigation.
It does not, by itself, prove that the price will continue rising.
Volume Charts
Volume charts help identify periods when trading activity increases or decreases.
Arkham’s market-data functionality includes historical volume information for supported assets and exchange markets.
Exchange Flow Charts
Exchange flows are particularly useful for monitoring whether assets are moving between exchanges and other wallet categories.
Arkham’s token research tools include aggregated flows and top-holder information, while its research materials describe exchange-flow analysis as a way to investigate movements into and out of exchanges.
However, an exchange deposit should not automatically be interpreted as a sale. The asset could be moved for custody, collateral, internal management or other purposes.
Futures Charts
Arkham’s market-data tools also include futures information such as volume, open interest and funding rates across supported exchange markets.
These metrics are useful when you want to understand derivatives positioning rather than spot-market activity alone.
Options Data
For options research, Arkham provides information such as volume, open interest, term structure and selected options Greeks.
This can be useful for traders examining implied volatility and derivatives positioning.
Important Arkham Metrics to Understand
Not every metric deserves equal attention. The most useful one depends on the research question.
Top Holders
Top-holder data helps identify wallets or entities controlling significant amounts of a token.
This can reveal:
- Large holders
- Exchange wallets
- Institutional wallets
- Project-related addresses
- Potentially concentrated ownership
Arkham token pages combine holder information with flows and transaction data.
Net Worth and Portfolio Balance
Entity and wallet pages can help users examine portfolio holdings and historical balance changes.
This is useful when tracking how a known entity’s crypto exposure changes over time.
Transaction History
Transaction history shows the actual movements behind a wallet or entity’s activity.
Look for:
- Large transfers
- Repeated transactions
- New counterparties
- Exchange interactions
- Changes in token exposure
- Transfers between related addresses
Exchange Flows
Exchange flows can help researchers monitor movement between exchanges and other wallets.
The important point is context. A single transaction rarely explains an entire investment decision.
Open Interest
Open interest is relevant to derivatives markets because it represents outstanding futures or perpetual positions.
When combined with price, volume and funding data, it can provide additional context about derivatives activity.
Funding Rate
Funding rates are particularly relevant to perpetual futures.
They can help indicate the relative cost or incentive for maintaining long and short positions, although funding alone should not be treated as a market-direction signal.
PnL and ROI
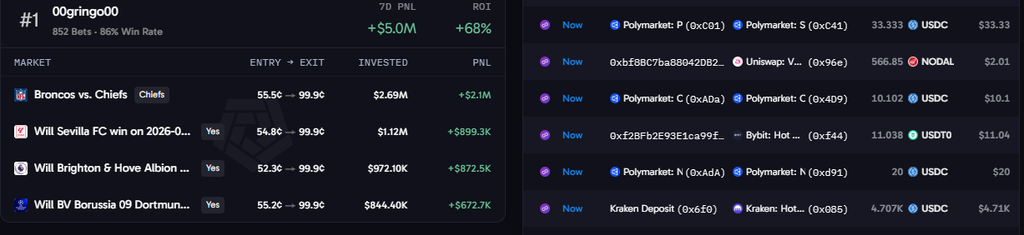
Arkham also provides analytics around certain trader and prediction-market activity, including PnL and ROI metrics.
These numbers can help compare trading performance, but historical profitability does not guarantee future results.
How to Use Arkham Charts for Crypto Research
A practical workflow is more useful than watching individual numbers.
Step 1: Start With the Asset
Search for the token or wallet you want to investigate.
For a token, begin with:
- Price
- Market cap
- Volume
- Supply
- Top holders
- Recent flows
Arkham’s token pages are designed to bring these different data points together.
Step 2: Examine the Largest Holders
Check whether ownership is distributed broadly or concentrated among a small number of wallets.
Then determine whether major holders appear to be:
- Exchanges
- Funds
- Project-related entities
- Known traders
- Unknown addresses
This gives the price chart more context.
Step 3: Check Recent Flows
Look at significant inflows and outflows.
If a large wallet has moved a substantial amount of tokens, investigate the receiving address instead of assuming the transaction represents buying or selling.
Step 4: Compare Price With On-Chain Activity
Now compare the market chart with wallet activity.
Questions to ask include:
- Did large transfers occur during the price move?
- Are major holders accumulating or reducing exposure?
- Is volume increasing?
- Are assets moving toward or away from exchanges?
- Is derivatives activity changing at the same time?
This approach is more informative than relying on one metric.
Arkham Dashboards: Putting Metrics Together
Dashboards are useful when you repeatedly monitor the same information.
Arkham dashboards can combine different units for address/entity intelligence, token information, general charts, exchange futures and options data.
A trader researching Bitcoin, for example, could build a dashboard around:
- BTC price
- Market activity
- Large-holder balances
- Exchange flows
- Historical volume
- Futures open interest
- Funding rates
- Selected wallet activity
The advantage is not simply having more charts. The real benefit is putting related signals into one research view.
Arkham Alerts Explained
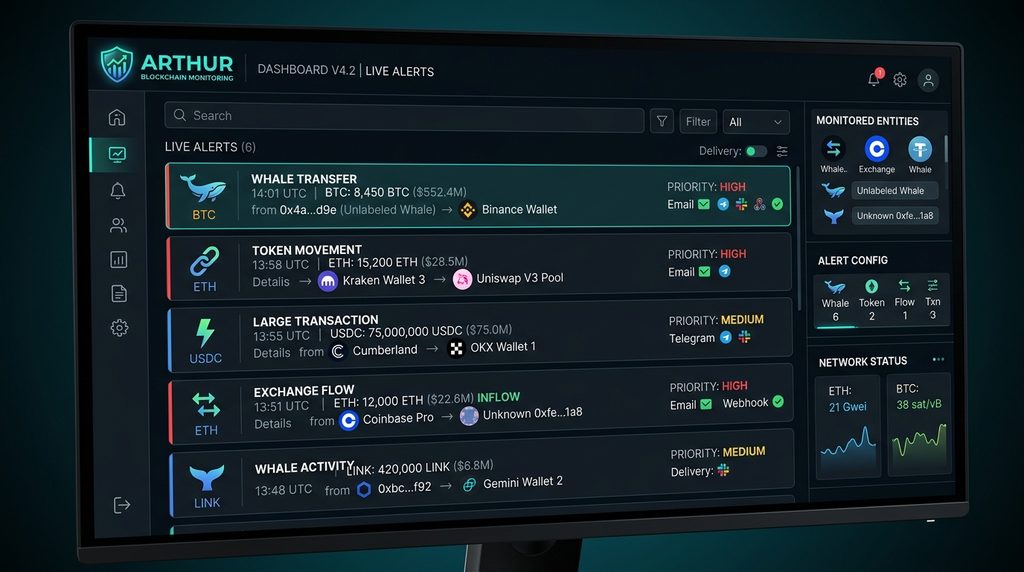
Arkham Alerts turn blockchain monitoring into an automated workflow.
Instead of repeatedly checking a wallet manually, you can create conditions that trigger notifications when relevant activity occurs. Arkham supports alerts involving entities, addresses, tokens, transaction values and other conditions. Notifications can be delivered through supported channels such as email, Telegram, Slack or webhooks.
What Can You Monitor?
Useful alert ideas include:
Large wallet transfers
Monitor transactions above a chosen value threshold.
Whale activity
Track transactions involving selected high-value wallets or entities.
Exchange movements
Monitor significant transfers involving exchange-related addresses.
Token activity
Create alerts around transactions involving a particular token.
Specific entities
Track an identified fund, organization, trader or other entity.
Blockchain activity
Use chain-specific conditions where supported.
Arkham’s alert documentation also describes filters involving USD/token value, tokens, senders, recipients and chains.
A Practical Arkham Alert Strategy
Don’t create dozens of alerts just because the platform allows detailed monitoring.
A better setup is to create alerts around events that would actually change your research.
For example:
Alert: Large BTC transfer from a watched entity
Threshold: Your chosen USD value
Purpose: Investigate significant movement
Then create a second alert for a different event, such as a major exchange inflow.
This keeps the signal-to-noise ratio manageable.
Why Arkham Entity Data Matters
One of Arkham’s biggest differences from basic block explorers is its entity and address-label system.
Arkham explains its approach as combining AI, address clustering, off-chain information, in-house research and community intelligence to connect blockchain addresses with real-world entities.
The result is that researchers can sometimes move beyond:
0x1234...
and investigate a known organization or entity associated with that address.
But this information needs to be interpreted carefully.
Arkham’s API documentation explicitly describes attribution as probabilistic and confidence-scored, meaning an attribution should not automatically be treated as absolute proof of ownership or identity.
Arkham Visualizer and Tracer
Charts are not the only way to understand Arkham data.
Visualizer
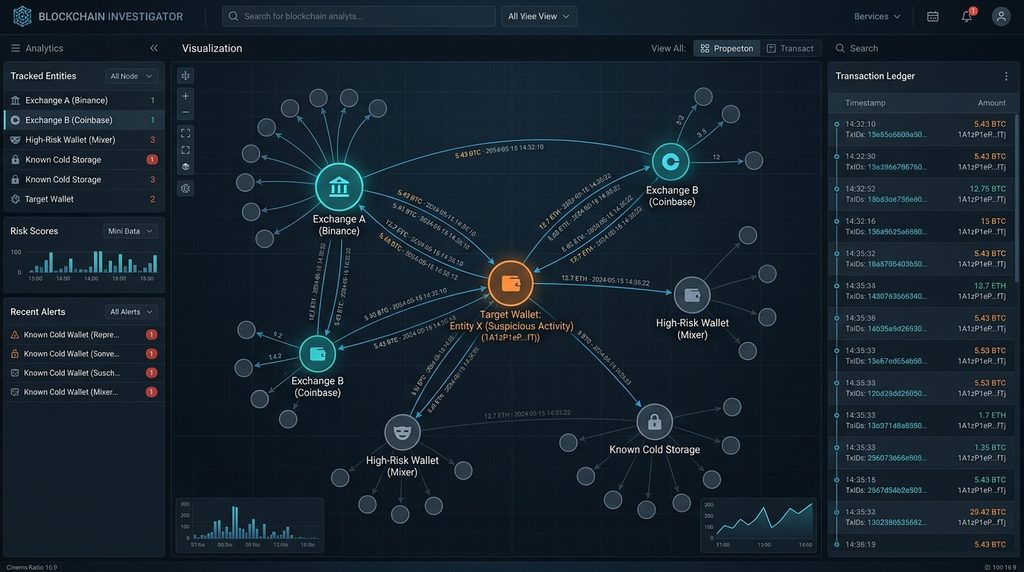
The Visualizer turns wallet and entity relationships into a network graph.
It can help researchers identify:
- Connected wallets
- Counterparties
- Transaction paths
- Large movements
- Relationships between entities
Users can filter visualized activity by factors such as token, transaction value and timeframe.
Tracer
Tracer is designed for following the movement of funds through blockchain addresses and intermediaries.
This can be especially useful in investigations where a simple transaction list becomes difficult to follow.
Arkham describes Tracer and Visualizer as dedicated investigative tools within its broader intelligence platform.
Arkham Data vs a Basic Block Explorer
A traditional block explorer and Arkham solve overlapping but different problems.
| Factor | Basic Block Explorer | Arkham |
|---|---|---|
| Transaction lookup | Strong | Strong |
| Raw blockchain data | Strong | Strong |
| Entity attribution | Limited | Core capability |
| Wallet relationships | Basic/manual | Visualized |
| Token research | Varies | Integrated |
| Custom dashboards | Limited/varies | Yes |
| Alerts | Varies | Yes |
| Market data | Varies | Spot, futures and options |
| Fund tracing | Basic/manual | Visualizer + Tracer |
| API | Depends on explorer | Arkham Intelligence API |
| Best use | Verifying transactions | Broader blockchain intelligence |
Arkham is therefore not necessarily a replacement for every block explorer. A researcher may still use a conventional explorer when the goal is to verify raw transaction-level blockchain information.
Arkham Data API
For developers and organizations, Arkham also offers an API.
The current API documentation describes an entity-first data model covering addresses, entities, labels and tags, along with authentication, rate limits, pagination and credit-based API pricing.
Arkham’s current API offering also advertises multi-chain coverage and access to additional intelligence such as HyperCore and Polymarket data.
This makes the API more relevant to teams that want to integrate blockchain intelligence into:
- Trading systems
- Research platforms
- Risk tools
- Compliance workflows
- Crypto applications
- Internal analytics
Is Arkham Data Free?
Availability and pricing can differ depending on the specific Arkham product or service.
The public platform provides access to a substantial amount of blockchain intelligence, while the Arkham API uses credit-based pricing according to its documentation.
Because Arkham’s product lineup and commercial terms can change, it is better to check the current official Arkham product or API page before making a purchasing decision.
What Are the Limitations of Arkham Data?
Arkham can make blockchain research easier, but its data should not be treated as infallible.
Attribution Is Not Absolute
An address-to-entity relationship can be based on evidence and confidence rather than definitive proof. Arkham’s own API documentation describes its attribution model as probabilistic.
On-Chain Activity Does Not Explain Intent
A wallet sending tokens to an exchange does not prove that the owner intends to sell.
Likewise, a large transfer does not automatically mean bullish or bearish activity.
Market Data and Blockchain Data Are Different
Price and derivatives metrics describe market activity, while wallet transfers describe blockchain activity.
Combining the two can be useful, but they should not be treated as identical signals.
Data Changes Over Time
Labels and entity information can evolve as new evidence becomes available. Arkham describes its intelligence as “living intelligence,” meaning attribution can change as new signals emerge.
Who Should Use Arkham?
Arkham is particularly useful for:
- Crypto traders
- On-chain researchers
- Blockchain investigators
- Investors studying token ownership
- Analysts tracking whales
- Researchers monitoring exchanges
- Developers needing blockchain intelligence
- Teams building crypto analytics products
It is less useful if you only need a simple current cryptocurrency price or a basic transaction hash lookup.
How to Get Better Results From Arkham
A few habits can make your research more reliable.
Use multiple metrics. Don’t make a decision from a single chart.
Investigate the wallet behind a transaction. Follow the receiving address and its counterparties.
Check holder concentration. Large ownership concentrations can change the risk profile of a token.
Separate facts from interpretation. “A wallet transferred $20 million” is a fact. “The wallet is preparing to sell” is an interpretation.
Verify important attribution. Entity labels can be extremely useful, but they should not automatically be treated as definitive identity proof.
Use alerts selectively. Monitor events that matter rather than every transaction.
Combine on-chain and market data. Price, volume, derivatives and wallet activity answer different questions.
Final Verdict: Is Arkham Data Worth Using?
For anyone doing serious on-chain research, Arkham is useful because it combines wallet intelligence, entity attribution, token data, charts, dashboards, fund tracing and alerts in one ecosystem. Its biggest advantage is the additional context around blockchain addresses rather than simply displaying raw transaction records.
The most important limitation is that blockchain intelligence still requires interpretation. A label, transaction, chart or alert is evidence to investigate—not an automatic explanation of why a market participant acted.
For beginners, start with token pages, top holders and transaction history. More experienced users can add dashboards, Visualizer, Tracer and customized alerts to build a more systematic research workflow.
Pros & Cons Table
| Pros | Cons |
|---|---|
| Combines wallet, entity, token and market intelligence | Entity attribution is not absolute proof of identity |
| Strong tools for tracking large wallets and entities | Large amounts of data can be overwhelming for beginners |
| Token pages provide price, holder and flow context | On-chain signals still require interpretation |
| Custom dashboards combine multiple metrics | Some advanced data and API functionality may be subject to product-specific terms |
| Real-time-style monitoring through alerts | Alerts can create significant noise if poorly configured |
| Visualizer and Tracer simplify complex fund movements | Market data and blockchain data should not be treated as the same signal |
| API supports developers and data workflows | Coverage and product capabilities can change over time |
Comparison Table
| Feature | Arkham | Basic Block Explorer | Glassnode |
|---|---|---|---|
| Wallet investigation | Strong | Strong | Strong |
| Entity attribution | Core feature | Limited | Different focus |
| Token holder analysis | Yes | Yes, depending on chain | Yes |
| Custom dashboards | Yes | Limited/varies | Yes |
| Wallet alerts | Yes | Varies | Yes, depending on product |
| Fund tracing | Visualizer + Tracer | Mostly manual | Analytics-focused |
| Market metrics | Spot, futures, options | Usually limited | Strong |
| Best for | Entity-centric on-chain intelligence | Transaction verification | Market/on-chain metrics |
Arkham itself describes Glassnode as a complementary tool focused on broader market data and curated charts, while Etherscan is more centered on granular transaction-level exploration.
Read more: How to Use Arkham for Crypto Research, Charts, or On-Chain Data
Alternatives
Etherscan
What it is: A widely used blockchain explorer, particularly for Ethereum ecosystem activity.
Main strength: Detailed transaction-level blockchain information.
Main limitation: Less focused on Arkham’s entity-centric intelligence model.
Best for: Verifying individual transactions, contracts and addresses.
Glassnode
What it is: A blockchain and market analytics platform.
Main strength: Broader market metrics, charts and analytical datasets.
Main limitation: Its workflow differs from Arkham’s entity-focused investigation model.
Best for: Market-level and on-chain metric research.
Bubblemaps
What it is: A blockchain visualization tool focused heavily on wallet relationships and token ownership.
Main strength: Visualizing holder concentration and wallet clusters.
Main limitation: More specialized than Arkham’s broader intelligence platform.
Best for: Understanding token-holder relationships and concentration.
Token Terminal
What it is: A crypto data and analytics platform focused on higher-level metrics.
Main strength: Aggregate protocol and market-level data.
Main limitation: Not designed primarily around Arkham-style entity investigation.
Best for: Fundamental crypto and protocol analysis.
FAQs
What is Arkham data?
Answer: Arkham data combines blockchain transactions, wallet balances, entity labels, token information, market data, charts, dashboards and alerts to help users investigate crypto activity.
What metrics does Arkham show?
Answer: Depending on the product and asset, Arkham can show price, market capitalization, volume, supply, holders, flows, open interest, funding rates, options information and wallet activity.
Can Arkham track whale wallets?
Answer: Yes. Users can search wallets or identified entities, examine holdings and transactions, and create alerts for selected activity.
Are Arkham entity labels always accurate?
Answer: They should be treated as intelligence rather than absolute proof. Arkham’s API documentation describes attribution as probabilistic and confidence-scored, and labels can evolve as new information becomes available.
Can Arkham show token prices and charts?
Answer: Yes. Arkham token pages and dashboards can provide token price information, charts, market data, holders and aggregated flows.
What are Arkham alerts used for?
Answer: Alerts can notify users when selected entities, addresses, tokens or transaction conditions meet specified criteria, helping automate ongoing blockchain monitoring.
Does Arkham provide an API?
Answer: Yes. Arkham provides an API for integrating blockchain intelligence into applications, products and workflows. Its documentation covers authentication, rate limits, pagination, credits and its address/entity data model.
Is Arkham better than a blockchain explorer?
Answer: It depends on the task. A traditional explorer can be better for straightforward transaction verification, while Arkham is particularly useful when you need entity attribution, wallet relationships, dashboards, alerts and broader intelligence.
Quick Take
Main point: Arkham combines raw blockchain activity with entity intelligence, market information and visualization tools.
Best use case: Tracking wallets, entities, token holders, flows and market activity.
Main advantage: It connects addresses and transactions with additional context through labels, entities, charts and investigative tools.
Main limitation: Arkham data still requires interpretation, and entity attribution is probabilistic rather than absolute.
Best alternative: Etherscan for detailed transaction verification; Glassnode for broader market and on-chain metrics.
Conclusion
Arkham is most valuable when you need more than a blockchain transaction list. Its combination of entity intelligence, wallet activity, token metrics, charts, dashboards, Visualizer, Tracer and alerts makes it suitable for deeper crypto research.
The strongest workflow is to combine several signals rather than rely on one metric. Start with the asset or entity, inspect holders and flows, compare activity with price and volume, then use alerts to monitor important changes.
Most importantly, treat Arkham as an investigative data platform, not a prediction engine. The data can help you understand what happened on-chain, but interpreting why it happened—and what happens next—still requires independent analysis.
Author Bio
TechyUpdate Editorial Team covers practical technology, AI tools, apps, software and digital productivity, with a focus on clear, useful and independently researched guides.